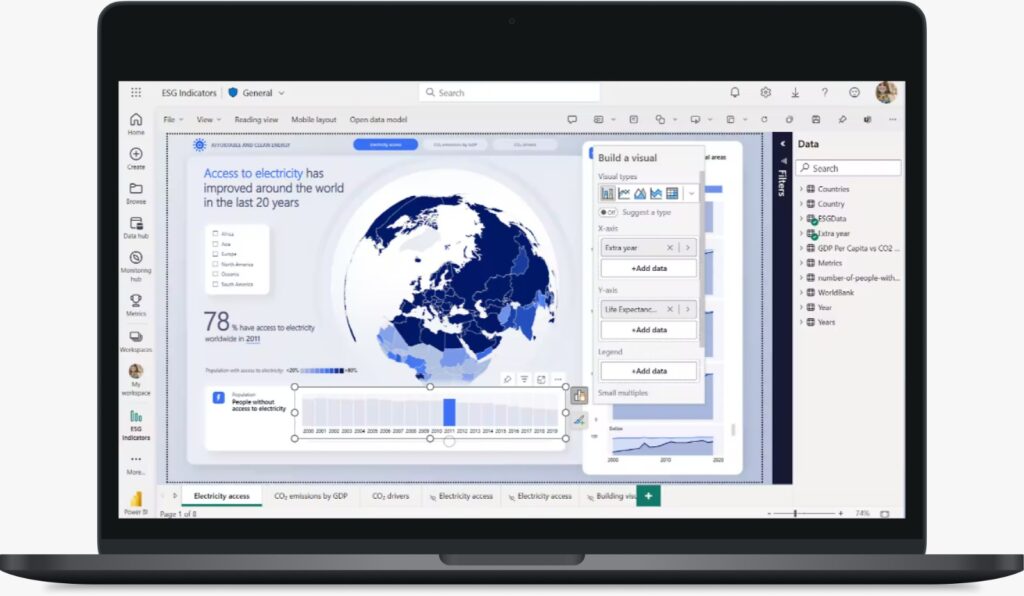
Power BI Dashboards

Transform Data into Action with Power BI Dashboards

HA-Consultancy offers advanced and customized portal solutions that empower organizations to establish interactive channels with customers, employees, and partners.

Built on Microsoft’s Power BI platform, our solutions feature interactive dashboards and data visualizations, providing centralized access to key business insights

Microsoft Power BI

Microsoft Power BI is a business analytics service that provides interactive visualizations and business intelligence capabilities. It enables users to create and share insightful reports and dashboards by connecting to various data sources.

Microsoft-Power-BI

Data Visualization

Create stunning visuals for data analysis and reporting.

Data Modeling

Build complex data models with relationships between data tables.

Power Query

Transform and clean data to prepare it for analysis.

AI Insights

Utilize AI features for text analytics, sentiment analysis, and more.

Our Solutions

The services delivered by HA Consultancy’s Power BI Dashboards solution are designed to empower organizations by providing advanced and customized portal solutions built on Microsoft’s Power BI platform.
Here’s how we can describe these services:

Customized Dashboard Development
Tailored development of interactive dashboards and data visualizations that meet specific business needs. Customization includes design, layout, and integration of key metrics and KPIs relevant to your organization.
Data Integration and Centralization
Integration of diverse data sources (e.g., CRM systems, ERP systems, databases) into centralized Power BI dashboards. Ensuring data accuracy, consistency, and accessibility for informed decision-making across the organization.

Interactive User Experience

Creation of user-friendly dashboards with interactive features such as drill-down capabilities, filters, and dynamic visuals. Empowering users to explore data, gain insights, and make data-driven decisions efficiently.
Collaboration and Sharing
Enable collaboration by sharing insights and dashboards securely with stakeholders, both internal teams and external partners. Implementing role-based access controls (RBAC) to ensure data security and compliance with organizational policies.
Continuous Monitoring and Optimization
Monitoring dashboard performance and user engagement to continuously optimize data visualization and improve dashboard effectiveness. Proactively identifying opportunities for enhancement and adjusting dashboards based on user feedback and evolving business needs.

Training and Support
Providing training sessions and documentation to empower users in leveraging Power BI dashboards effectively. Offering ongoing support to address technical issues, refine dashboard functionality, and assist with dashboard adoption across the organization.

Optimize your business insights with Power BI Dashboards.

HA Consultancy’s Power BI Dashboards solution enables organizations to transform raw data into actionable insights, fostering better decision-making, enhancing operational efficiency, and driving business growth.

Insightful Dashboards, Informed Decisions

Roadmap

Implementing a Power BI Dashboards solution involves several key steps to ensure effective deployment and utilization across your organization. Here’s a roadmap outlining the typical phases:

1
Assessment and Planning

We begin with in-depth workshops to understand your business objectives and data requirements. We analyze existing data sources and collaboratively define clear goals for your Power BI implementation.

2
Data Preparation and Integration

Our team identifies and prioritizes the relevant data sources, then meticulously cleanses and models the data to ensure accuracy. We integrate the data into Power BI to establish a unified data model.

3
Dashboard Design and Development

We craft wireframes and designs tailored to your key performance indicators (KPIs). Our experts then develop interactive dashboards in Power BI, iterating on feedback to ensure usability and alignment with your business needs.

4
Deployment and Testing

We create a detailed deployment plan that includes comprehensive training and communication strategies. User Acceptance Testing (UAT) and performance testing are conducted to guarantee the dashboards' functionality and efficiency.

5
Training and Adoption

We deliver extensive user training and provide clear documentation. To encourage adoption, we implement change management strategies that ensure your team effectively utilizes the new dashboards.

6
Maintenance and Optimization

We continuously monitor dashboard performance and gather user feedback. Regular updates and iterative improvements are made to enhance usability and keep the dashboards relevant to your evolving needs.

7
Governance and Security

We establish robust data governance policies and implement role-based access controls to safeguard your data. Regular audits are performed to ensure compliance with security standards and policies.

Industries We serve

Our solutions utilize Power BI dashboards to provide tailored insights across industries. Track field service performance, optimize retail operations, enhance hospitality guest experiences, and ensure government transparency with real-time analytics and performance monitoring designed to address your unique challenges.

By using Power BI Dashboards to track service technician metrics, you enhance performance monitoring and optimize field service schedules. This results in more efficient resource management and proactive decision-making based on real-time insights.

Implementing Power BI Dashboards facilitates the monitoring of guest satisfaction and operational metrics, enhancing guest experiences and streamlining hotel management. Real-time data on bookings and pricing supports informed revenue management decisions and optimizes resource allocation.

Leveraging Power BI Dashboards for sales and inventory management provides detailed insights into customer behavior and store performance. This enables targeted marketing and operational efficiencies, leading to increased sales and reduced costs.

Developing dashboards to analyze citizen feedback and service usage patterns enhances transparency and community engagement. Monitoring service delivery metrics and KPIs improves operational efficiency and ensures better compliance with regulatory standards.

Frequently Asked Questions

Power BI Dashboards offer several benefits, including real-time data visualization, actionable insights, improved decision-making, operational efficiency, and enhanced collaboration. They empower organizations to monitor key metrics, track performance, and drive strategic initiatives based on data-driven insights.

Power BI Dashboards seamlessly integrate with a wide range of data sources, including Microsoft Excel, SQL databases, CRM systems like Dynamics 365, cloud services like Azure, and many others. This integration allows organizations to consolidate data from multiple sources into unified dashboards for comprehensive analysis and reporting.

Our Power BI Dashboards solution is beneficial across various industries, including finance, healthcare, manufacturing, retail, and more. Whether you need to analyze sales performance, optimize supply chain operations, monitor patient outcomes, or track operational metrics, Power BI Dashboards provide customizable insights tailored to specific industry needs.

contact

Get in touch

Contact us below and we will get back to you shortly.